Key Session Levels (KUUUMZ)
📜 Summary
Tired of manually drawing the same key levels every single trading day? The KUUMZ-Key Session Levels indicator automates this entire process, plotting the most critical intraday and previous day levels directly on your chart. This tool provides a clean, dynamic framework of potential support and resistance zones, allowing you to focus on your trading strategy, not on chart setup.
Built for day traders and scalpers of US equities, this indicator helps you instantly visualize the market's structure from the moment the session begins.
🎯 Key Levels Plotted
This indicator automatically identifies and draws horizontal lines for the following session levels:
Previous Day High (PDH) & Low (PDL): The highest and lowest points of the prior trading day, which often act as major psychological support and resistance magnets.
Pre-Market High & Low (PMH/PML): The range established during the pre-market session (4:00 - 9:30 AM ET). A breakout from this range can often signal the initial directional bias.
5-Minute Opening Range High & Low (OR5): The high and low of the first 5 minutes of the regular session (9:30 - 9:35 AM ET). A crucial level for opening range breakout (ORB) strategies.
15-Minute Opening Range High & Low (OR15): The high and low of the first 15 minutes (9:30 - 9:45 AM ET), providing a slightly broader view of the initial balance area.
📈 How to Use This Indicator
These levels are fundamental to many intraday trading strategies:
Support & Resistance: Watch how price reacts as it approaches these levels. A bounce or rejection can signal a potential reversal, while a clean break can indicate continuation.
Breakout Trading: A strong, high-volume move through one of these levels (e.g., breaking above the Pre-Market High) can be an entry signal for a breakout trade.
Market Context: Quickly gauge market sentiment. Is the price trading above or below the previous day's range? Is it trapped within the opening range? These levels provide immediate context to the current price action.
Setting Targets & Stops: Use these levels to set logical profit targets or place stop-loss orders. For example, if you go long on a breakout of the 5-min OR, the Pre-Market High or Previous Day High could be your first target.
⚙️ Features & Customization
The script is designed to be flexible and clean, allowing you to tailor it to your specific charting style.
Toggle Any Level: Enable or disable any set of levels (Previous Day, Pre-Market, etc.) to reduce clutter.
Full Style Control: Customize the Color, Width, and Style (Solid, Dotted, Dashed) for each pair of high/low lines independently.
Optional Labels: A master switch allows you to show or hide all price labels (like "PDH", "PM Low", etc.) with a single click.
Automatic & Dynamic: Levels are calculated and drawn in real-time as each session concludes and are automatically cleared and reset for the next trading day.
在脚本中搜索"horizontal line"

Desempenho 4ªs (MA)This Pine Script v5 indicator calculates the performance from Wednesday to Wednesday at 10:30 AM for the charted instrument. Every Wednesday at that time, it records the closing price and computes the percentage change, assigning a signal: +1 for increases above 1 %, -1 for declines below -1 %, and 0 for intermediate movements. It plots a five-period simple moving average on the main chart, color-coded green, red, or gray based on the weekly signal. Vertical dotted lines mark each weekly separation, and two blue horizontal lines denote the ±1 % thresholds for the current week. A label displays the performance percentage and signal.

Custom P&L Tool (EUR/USD)This tool lets you visually calculate potential Profit & Loss, Risk:Reward, and pip distances for a trade based on your:
Entry price
Stop Loss (SL)
Take Profit (TP)
Lot size (0.01 up to 10 lots)
Trade direction (Long or Short)
🔹 Automatically shows horizontal lines for Entry, TP, and SL
🔹 Displays a live P&L table with:
TP pips
SL pips
Estimated profit/loss in USD
Risk:Reward ratio

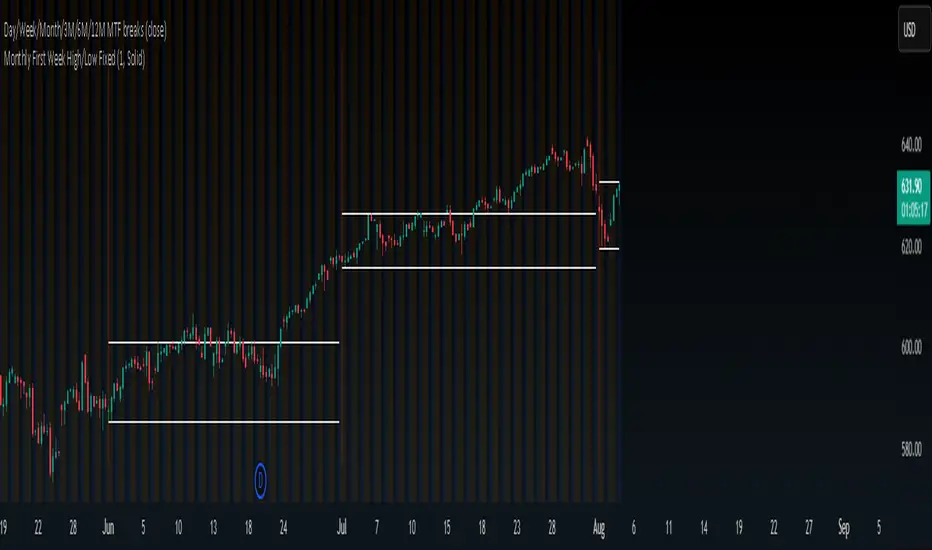
First week high/low of the monthThis is a simple indicator that draws two customizable horizontal lines representing the first week of the month.
Accumulation Phase DetectorClean Accumulation Phase Indicator — Description
This TradingView indicator visually identifies the Accumulation Phase in price action, based on the Wyckoff methodology and volume-price analysis. The Accumulation Phase is where insiders or "smart money" gradually build positions before a significant price breakout.
Key Features:
Range Detection: The indicator calculates a price range over a configurable period (Range Length). It marks this range on the chart with red horizontal lines representing support and resistance.
Volume Spike Identification: It detects unusually high volume relative to the average volume over the same period (Volume Spike Multiplier). These spikes highlight potential insider buying activity.
Accumulation Phase Highlighting: When price action remains within the detected range and volume spikes occur, the indicator considers the market to be in an accumulation phase. Volume bars during this phase are colored blue for easy visualization.
Campaign Start & End Labels: The indicator places a "Campaign starts" label at the beginning of the accumulation phase and a "Campaign ends - warehouse full" label when the accumulation ends. This mimics the idea that insiders fill their “warehouses” before a breakout.
Breakout Detection: Once accumulation ends, the indicator monitors for a price breakout above the resistance level and places a "Breakout" label at the breakout bar.
How to Use:
Adjust the Range Length and Volume Spike Multiplier inputs to suit the timeframe and instrument you’re analyzing.
Watch for the blue volume bars within the red range lines to identify the accumulation phase.
Use the campaign labels to identify when the phase starts and ends.
Watch for the breakout label as a potential entry signal.

NY Premarket – High/LowNY Premarket – High/Low
Displays two horizontal lines for the last completed New York pre‑market session (07:00–09:30 America/New_York):
Premarket High (top wick of the session)
Premarket Low (bottom wick of the session)
Both lines are anchored to the exact candles that formed the session’s high/low and remain aligned with those candles regardless of zooming or panning.ng or panning.
ombs- PONY Breakout Alert
🧠 תקציר הסקריפט: **PONY Breakout Alert 📈
🔍 **מטרה**:
לזהות **פריצה מעלה של רמת 14.15** תוך כדי **מחזור מסחר גבוה מהממוצע**, כדי לאתר **הזדמנות מסחר שורית**.
---
⚙️ רכיבי הסקריפט:
* 📌 **רמת כניסה**:
`entryLevel = 14.15`
* 📊 **תנאי כניסה**:
* סגירת מחיר **מעל 14.15**
* נפח מסחר **גבוה ב־20% מהממוצע ל־20 הימים האחרונים**
* 🔔 **התראה ויזואלית**:
* סמל ירוק "Entry" מופיע מתחת לנר על הגרף
* קווים קבועים לרמות יעד וסטופלוס
* 🎯 **יעדי רווח**:
* Target 1 – 15.15
* Target 2 – 16.00
* Target 3 – 17.00
* 🛑 **סטופלוס**:
* שמרני: 13.20
* אגרסיבי: 12.80
* 🔔 **התראה אוטומטית** (`alertcondition`):
תשלח הודעה:
*"PONY פרצה מעל 14.15 עם מחזור גבוה – שקול כניסה לעסקה."*
---
📝 מתאים עבור:
* סוחרי ניתוח טכני 🧮
* מי שמחפש כניסה מבוססת על פריצה + נפח 📊
* שימוש על גרף יומי בלבד 📅
---
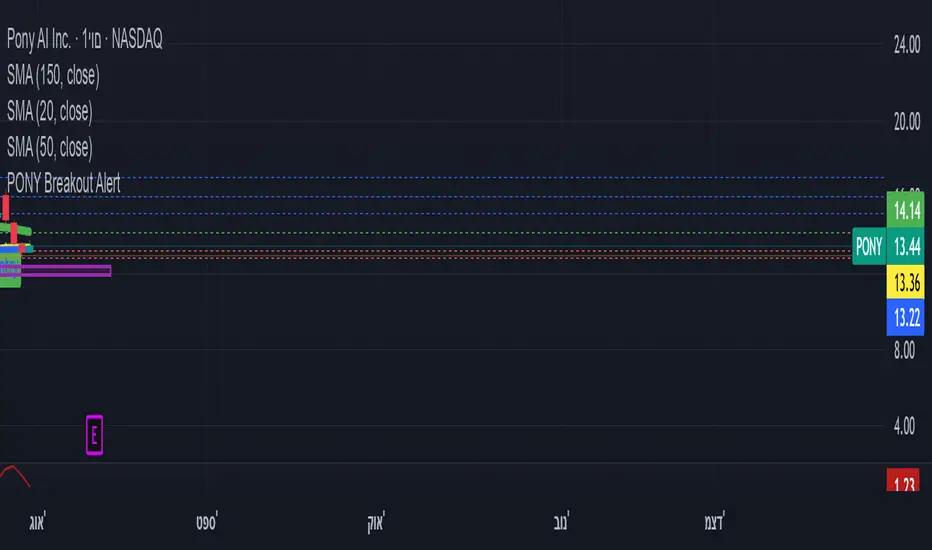
🧠 Script Summary: PONY Breakout Alert 📈
🔍 Objective:
Detect a breakout above the 14.15 level accompanied by high trading volume, in order to identify a bullish trading opportunity.
⚙️ Script Components:
📌 Entry Level:
entryLevel = 14.15
📊 Entry Conditions:
Price closes above 14.15
Volume is 20% higher than the 20-day average
🔔 Visual Alert:
A green "Entry" label appears below the bar on the chart
Static horizontal lines mark targets and stop-loss levels
🎯 Profit Targets:
Target 1 – 15.15
Target 2 – 16.00
Target 3 – 17.00
🛑 Stop Loss:
Conservative: 13.20
Aggressive: 12.80
🔔 Automated Alert (alertcondition):
Sends a message:
"PONY has broken above 14.15 with high volume – consider a long position."
📝 Ideal For:
Technical traders 🧮
Those seeking breakouts confirmed by volume 📊
Daily chart setups only 📅
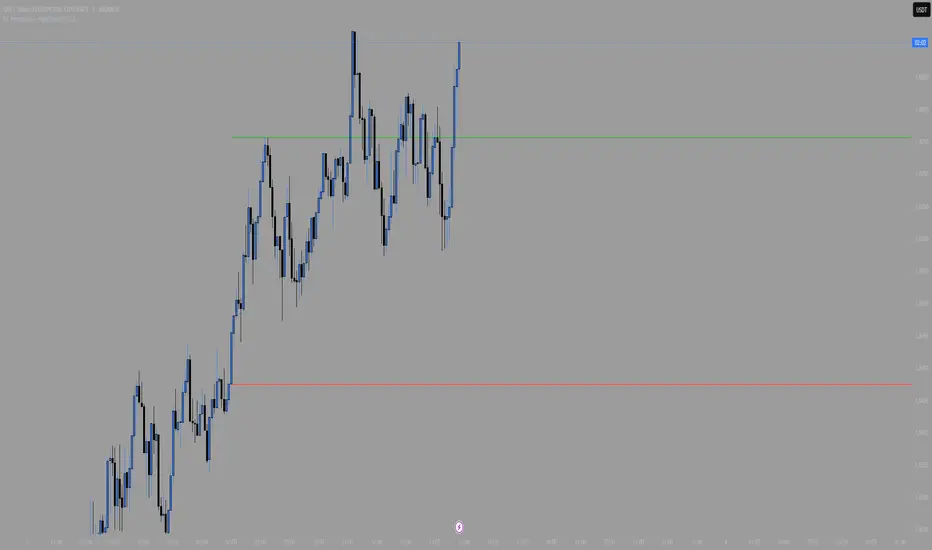
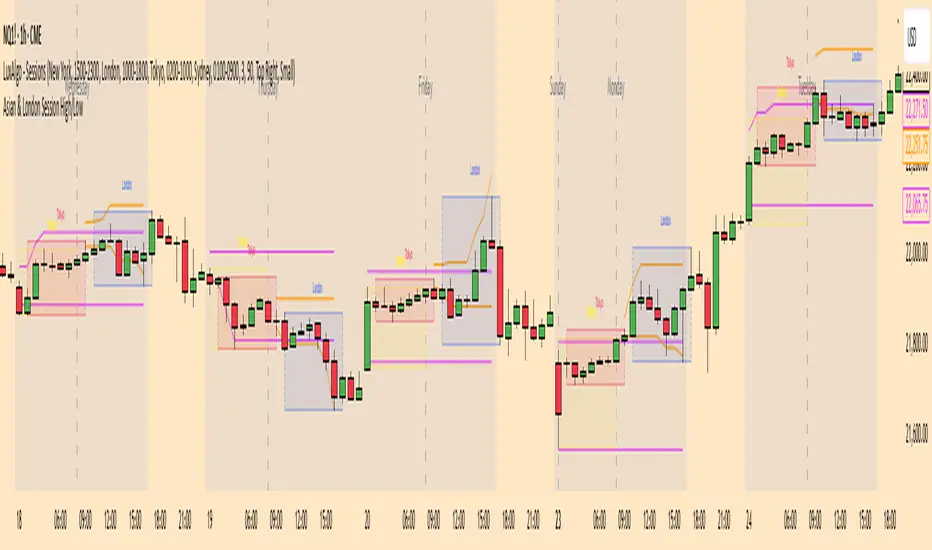
Asian & London Session High/LowThis Pine Script v6 indicator plots the high and low of the Asian and London trading sessions on the chart before the New York session opens.
Asian session is defined from 00:00 to 08:00 (Europe/Sofia time).
London session is defined from 09:00 to 16:30 (Europe/Sofia time).
The session highs and lows are tracked live and updated as new candles form within the session time ranges.
At 16:30, when the New York session opens, all high/low values are reset to na to prepare for the next day.
Horizontal lines are plotted using plot.style_linebr to extend the lines until the next candle.
This tool helps traders identify key support/resistance zones formed during the most active pre-New York hours.
RSI Zones - Directional Entry Strict RSI Zones – Directional Entry Tool (Modified RSI)
This is a simple modification of the standard RSI indicator. I’ve added two custom horizontal lines at the 60–65 and 35–40 zones to help spot momentum shifts and potential reversal points.
60–65 zone: When RSI returns here from above 65, it often signals weakening bullish momentum — useful for spotting short opportunities.
35–40 zone: When RSI returns here from below 35, it can indicate momentum loss on the downside — good for potential long setups.
This version helps traders filter out weak signals and avoid chasing extreme moves.
It works best when combined with price action, structure, or divergence.
Only 2 lines were added to the default RSI for better zone awareness. Everything else remains unchanged.

NDX Levels Adjusted to Active TickerThis indicator allows you to plot custom NDX levels directly on the NQ1! (E-mini NASDAQ-100 Futures) chart, automatically adjusting for the spread between NDX and NQ1!. This is particularly useful for traders who perform technical analysis on NDX but execute trades on NQ1!.
Features:
Input up to three NDX key levels to track (e.g., 23000, 24000, 25000).
The script adjusts these levels in real-time based on the current spread between NDX and NQ1!
Displays the spread in the chart header for quick reference
Plots updated horizontal lines that move with the spread
Includes optional labels showing the spread periodically to reduce clutter
Supports Multiple Tickers: NQ1!, QQQ, NAS100 and NAS100USD.
Ideal for futures traders who want SPX context while trading NQ1!, QQQ, NAS100 or NAS100USD..

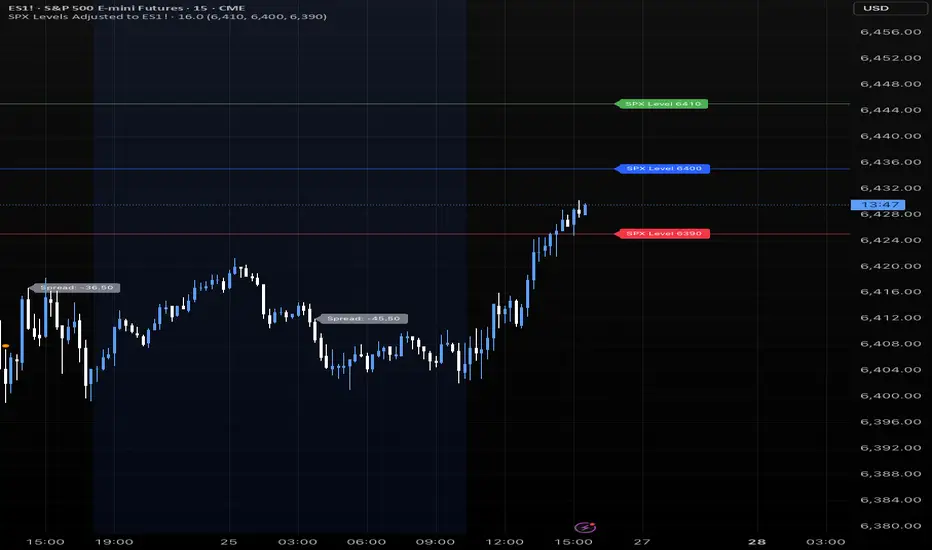
SPX Levels Adjusted to Active TickerThis indicator allows you to plot custom SPX levels directly on the ES1! (E-mini S&P 500 Futures) chart, automatically adjusting for the spread between SPX and ES1!. This is particularly useful for traders who perform technical analysis on SPX but execute trades on ES1!.
Features:
Input up to three SPX key levels to track (e.g., 5000, 4950, 4900)
The script adjusts these levels in real-time based on the current spread between SPX and ES1!
Displays the spread in the chart header for quick reference
Plots updated horizontal lines that move with the spread
Includes optional labels showing the spread periodically to reduce clutter
Supports Multiple Tickers, ES1!, SPY and SPX500USD.
Ideal for futures traders who want SPX context while trading ES1!.

Fractal Support and Resistance [BigBeluga]🔵 OVERVIEW
The Fractal Support and Resistance indicator automatically identifies high-probability support and resistance zones based on repeated fractal touches. When a defined number of fractal highs or lows cluster around the same price zone, the indicator plots a clean horizontal level and shaded zone, helping traders visualize structurally important areas where price may react.
🔵 CONCEPTS
Fractal Points: Swing highs and lows based on user-defined left and right range (length). A valid fractal forms only when the center candle is higher or lower than its neighbors.
Zone Validation: A level is only confirmed when the price has printed the specified number of fractals (e.g., 3) within a narrow ATR-defined range.
Dynamic Zone Calculation: The plotted level can be based on the average of clustered fractals or on the extreme value (min or max), depending on the user’s choice.
Support/Resistance Zones: Once a zone is validated, a horizontal line and shaded box are drawn and automatically extended into the future until new valid clusters form.
Auto-Clean & Reactivity: Each zone persists until replaced by a new fractal cluster, ensuring the chart remains uncluttered and adaptive.
🔵 FEATURES
Detects swing fractals using adjustable left/right range.
Confirms zones when a defined number of fractals occur near the same price.
Plots horizontal level and shaded box for visual clarity.
Choice between average or min/max logic for level calculation.
Distinct color inputs for support (green) and resistance (orange) zones.
Adaptive auto-extension keeps valid zones projected into the future.
Displays optional triangle markers above/below bars where fractals form.
Clean design optimized for structural S/R analysis.
🔵 HOW TO USE
Use support zones (from low fractals) to look for potential long entries or bounce points .
Use resistance zones (from high fractals) to look for short setups or rejections .
Adjust the Fractals Qty to make zones more or less strict—e.g., 3 for higher reliability, 2 for quicker responsiveness.
Combine with liquidity indicators or break/retest logic to validate zone strength.
Toggle between average and min/max mode to fit your style (average for balance, extremes for aggression).
🔵 CONCLUSION
Fractal Support and Resistance offers a robust way to identify hidden levels that the market respects repeatedly. By requiring multiple fractal confirmations within a zone, it filters out noise and highlights clean structural areas of interest. This tool is ideal for traders who want automatic, adaptive, and reliable S/R levels grounded in raw market structure.

ORB Range Indicator with Fibonacci Targets
This script plots the Opening Range (ORB) high and low based on a configurable time window (5–45 minutes from the U.S. session open at 9:30 AM EST).
Once the ORB window closes, the indicator draws horizontal lines marking:
ORB High and Low
The size of the range in price and %
Fibonacci-based price targets above and below the range (0.382, 0.618, 1.000, 1.618, 2.000)
You can control:
Which Fibonacci levels to display
Whether to show long targets, short targets, or both
All drawings are automatically cleared at the start of each trading day.
Ideal for breakout traders using ORB and Fibonacci extensions for target planning.

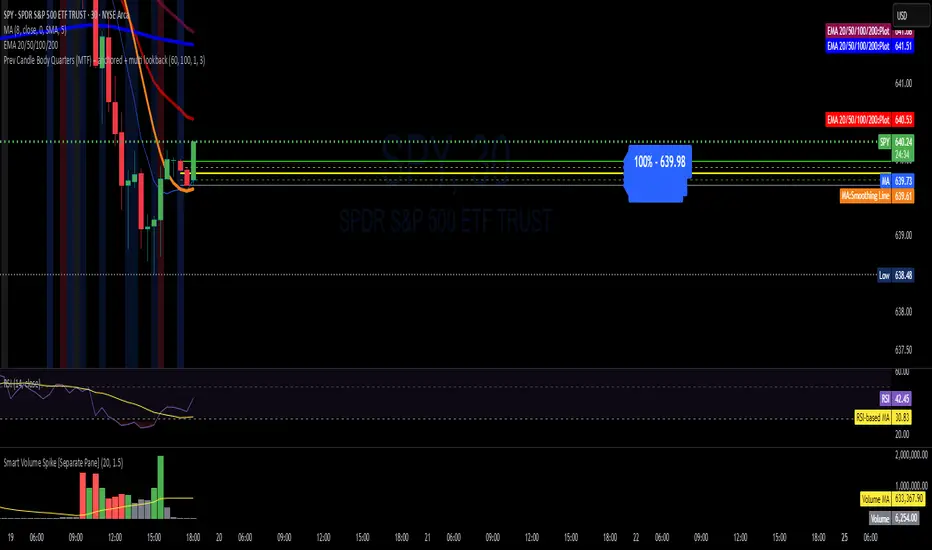
Prev Candle Quarters (MTF) – % + PriceThis TradingView indicator visualizes quarter levels (25%, 50%, 75%, 100%) of the previous candle body from a user-selected higher timeframe, helping traders identify key reaction zones within a candle’s structure.
ulti-Timeframe Input: Choose between 15m, 1H, or 2H candles for your measurement basis.
Body-Based Calculation: Measures from open to close of the previous candle (not wick-to-wick), reflecting where price actually closed.
Precise Quarter Levels: Automatically draws horizontal lines at 25%, 50%, 75%, and 100% of the candle body.
Custom Toggles: Enable or disable each individual level via checkboxes.
Price + % Labels: Each level includes a clean label showing the exact price and corresponding percentage.
SPX Levels Adjusted to ES1!This indicator allows you to plot custom SPX levels directly on the ES1! (E-mini S&P 500 Futures) chart, automatically adjusting for the spread between SPX and ES1!. This is particularly useful for traders who perform technical analysis on SPX but execute trades on ES1!.
Features:
Input up to three SPX key levels to track (e.g., 5000, 4950, 4900)
The script adjusts these levels in real-time based on the current spread between SPX and ES1!
Displays the spread in the chart header for quick reference
Plots updated horizontal lines that move with the spread
Includes optional labels showing the spread periodically to reduce clutter
Ideal for futures traders who want SPX context while trading ES1!.
Make sure to apply this indicator on the ES1! chart, not SPX.
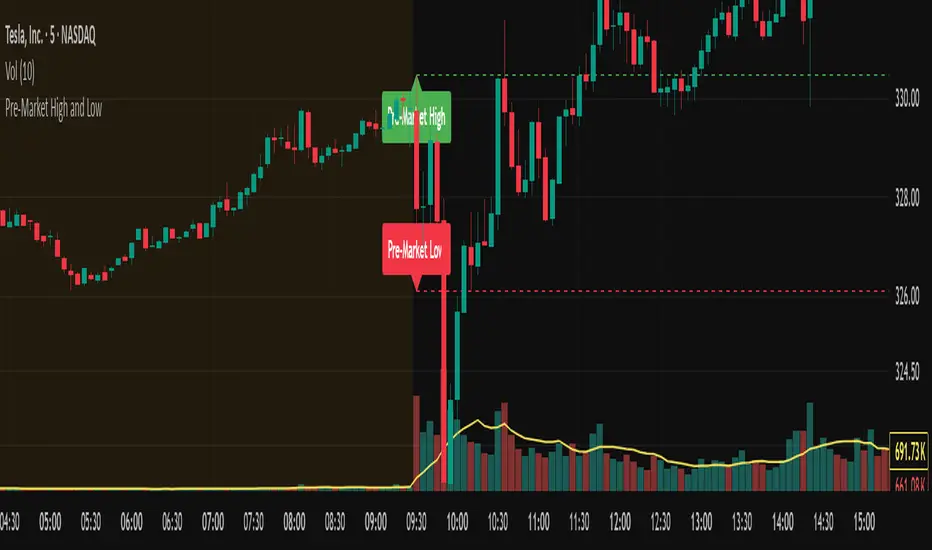
Pre-Market High and LowThis indicator automatically tracks and plots the daily pre-market high and low levels on your chart for U.S. stocks. It monitors the pre-market session from 4:30 AM to 9:30 AM Eastern Time (New York) and captures the highest and lowest prices during this period.
At exactly 9:30 AM ET, when the regular market opens, the indicator draws dashed horizontal lines representing the pre-market high and pre-market low, extending them forward for better visibility throughout the trading day.